Overview
Slideflow provides tools for easily building and testing a variety of deep learning models for digital pathology.
This section provides a high-level overview of the most common application: building and testing a weakly supervised predictive model. Slideflow supports many other tasks, including multiple-instance learning (MIL), self-supervised learning (SSL), generative adversarial networks (GANs), tissue and cell segmentation, and deployment & visualization, which are discussed in subsequent sections.
High-level overview of model building.
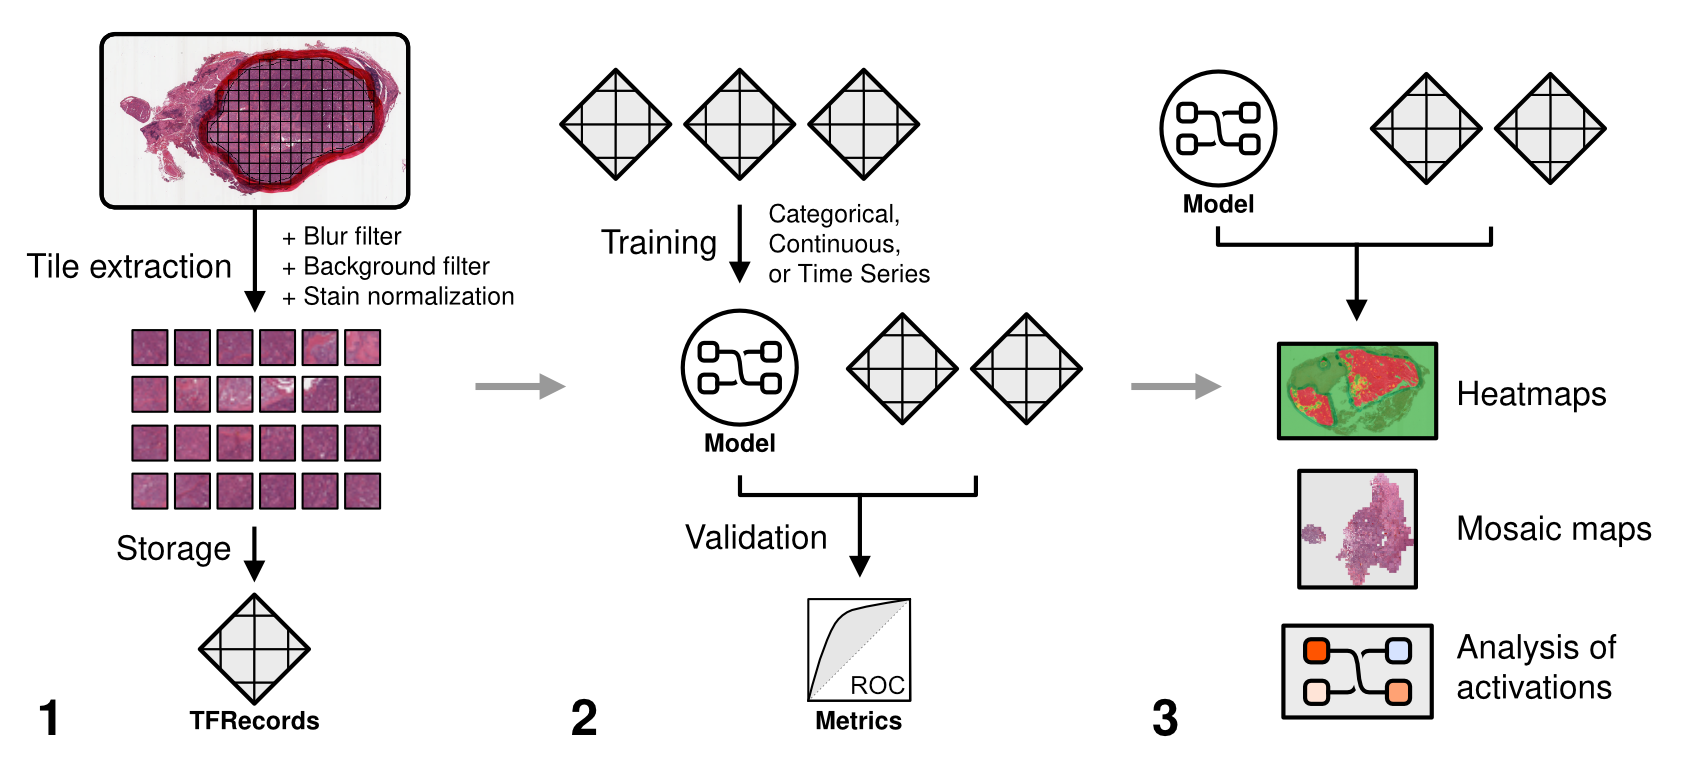
The pipeline for a deep learning classification experiment is separated into three phases.
Tile extraction - annotate slides with regions of interest (ROIs) [optional] and extract image tiles from whole-slide images.
Model training - determine model parameters, train a model, and evaluate the model on a held-out test set.
Explainability - generate predictive heatmaps and analyze learned image features.
A brief introduction to the steps needed to execute a basic experiment is provided below. Each process will be described in more detail in the following sections.
Step 1: Prepare a dataset
Extract tiles. Tiles are extracted from slides at a given magnification size in microns (or a magnification layer, such as “10x”), and saved at a given resolution in pixels. The optimal extraction size in both microns and pixels will depend on your dataset and model architecture. Poor quality tiles - including background tiles or tiles with high whitespace content - can be discarded with quality control methods. Tiles will be stored as TFRecords, a binary file format used to improve dataset reading performance during training. Each slide will have its own TFRecord file containing its extracted tiles.
Set aside final evaluation set. Split the dataset into a training/validation set and held-out test set.
Determing validation plan. By default, three-fold cross-validation will be performed during training. Many other validation strategies are also supported (Training/Validation Splitting).
Step 2: Train a model
Choose model type. Choose the endpoint (e.g. classification, regression, time-to-event) and type of model (tile-based or multiple-instance learning).
Set hyperparameters. Choose a model architecture (e.g. InceptionV3, VGG16, ResNet, etc.) and a set of hyperparameters (e.g. batch size, learning rate, etc.). This can be done manually, or hyperparameters can be optimized via grid search or Bayesian optimization.
Initiate training. Train your model, taking note of training and validation performance (e.g. accuracy, AUROC, AP, R-squared, C-index).
Step 3: Evaluate the model
Evaluate on held-out set: Evaluate your final model model on the held-out dataset.
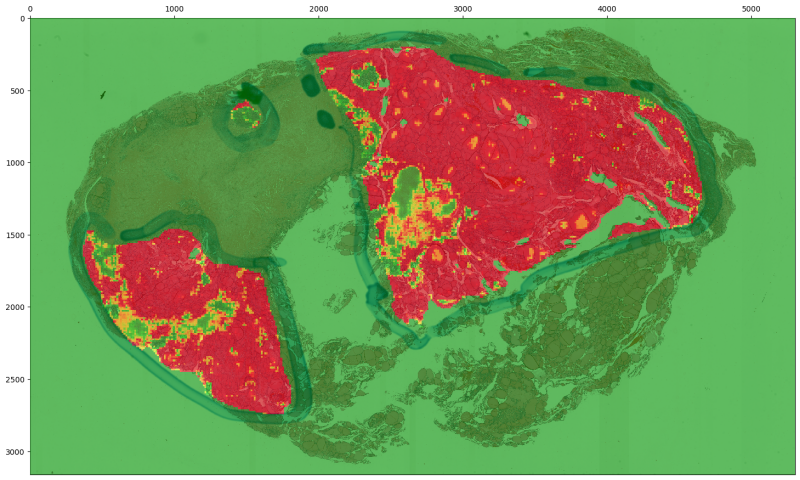
Step 4: Generate heatmaps
Generate heatmaps: Generate heatmaps of predictions across slides in the held-out dataset to assist with interpretability. For MIL models, heatmaps of both predictions and attention can be generated.
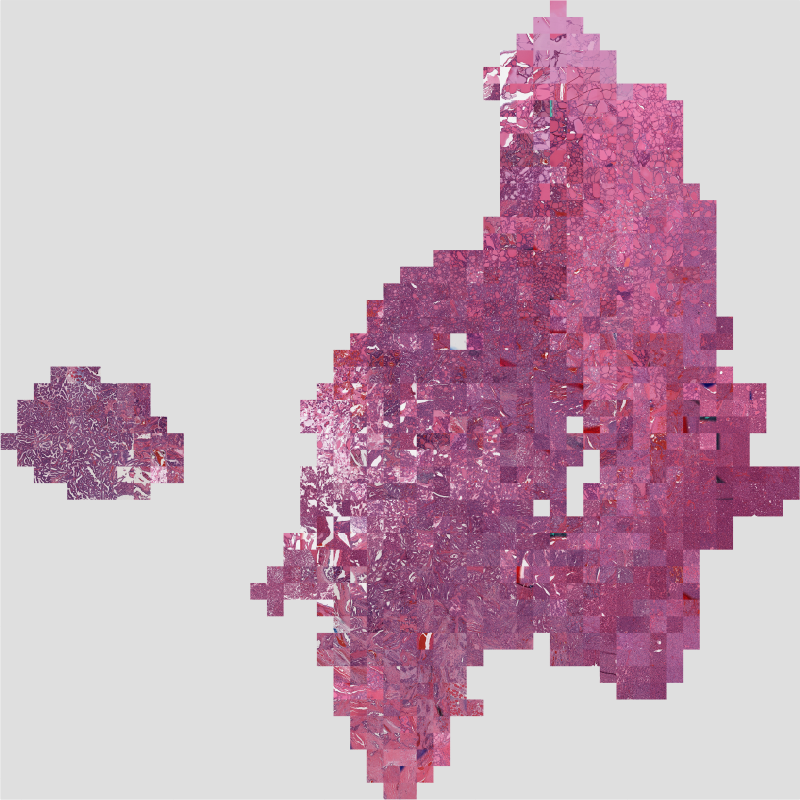
Step 5: Make a Mosaic map
Generate a mosaic map: Create a mosaic map, which visually illustrates the latent space of your trained model and held-out dataset, to assist with interpretability.
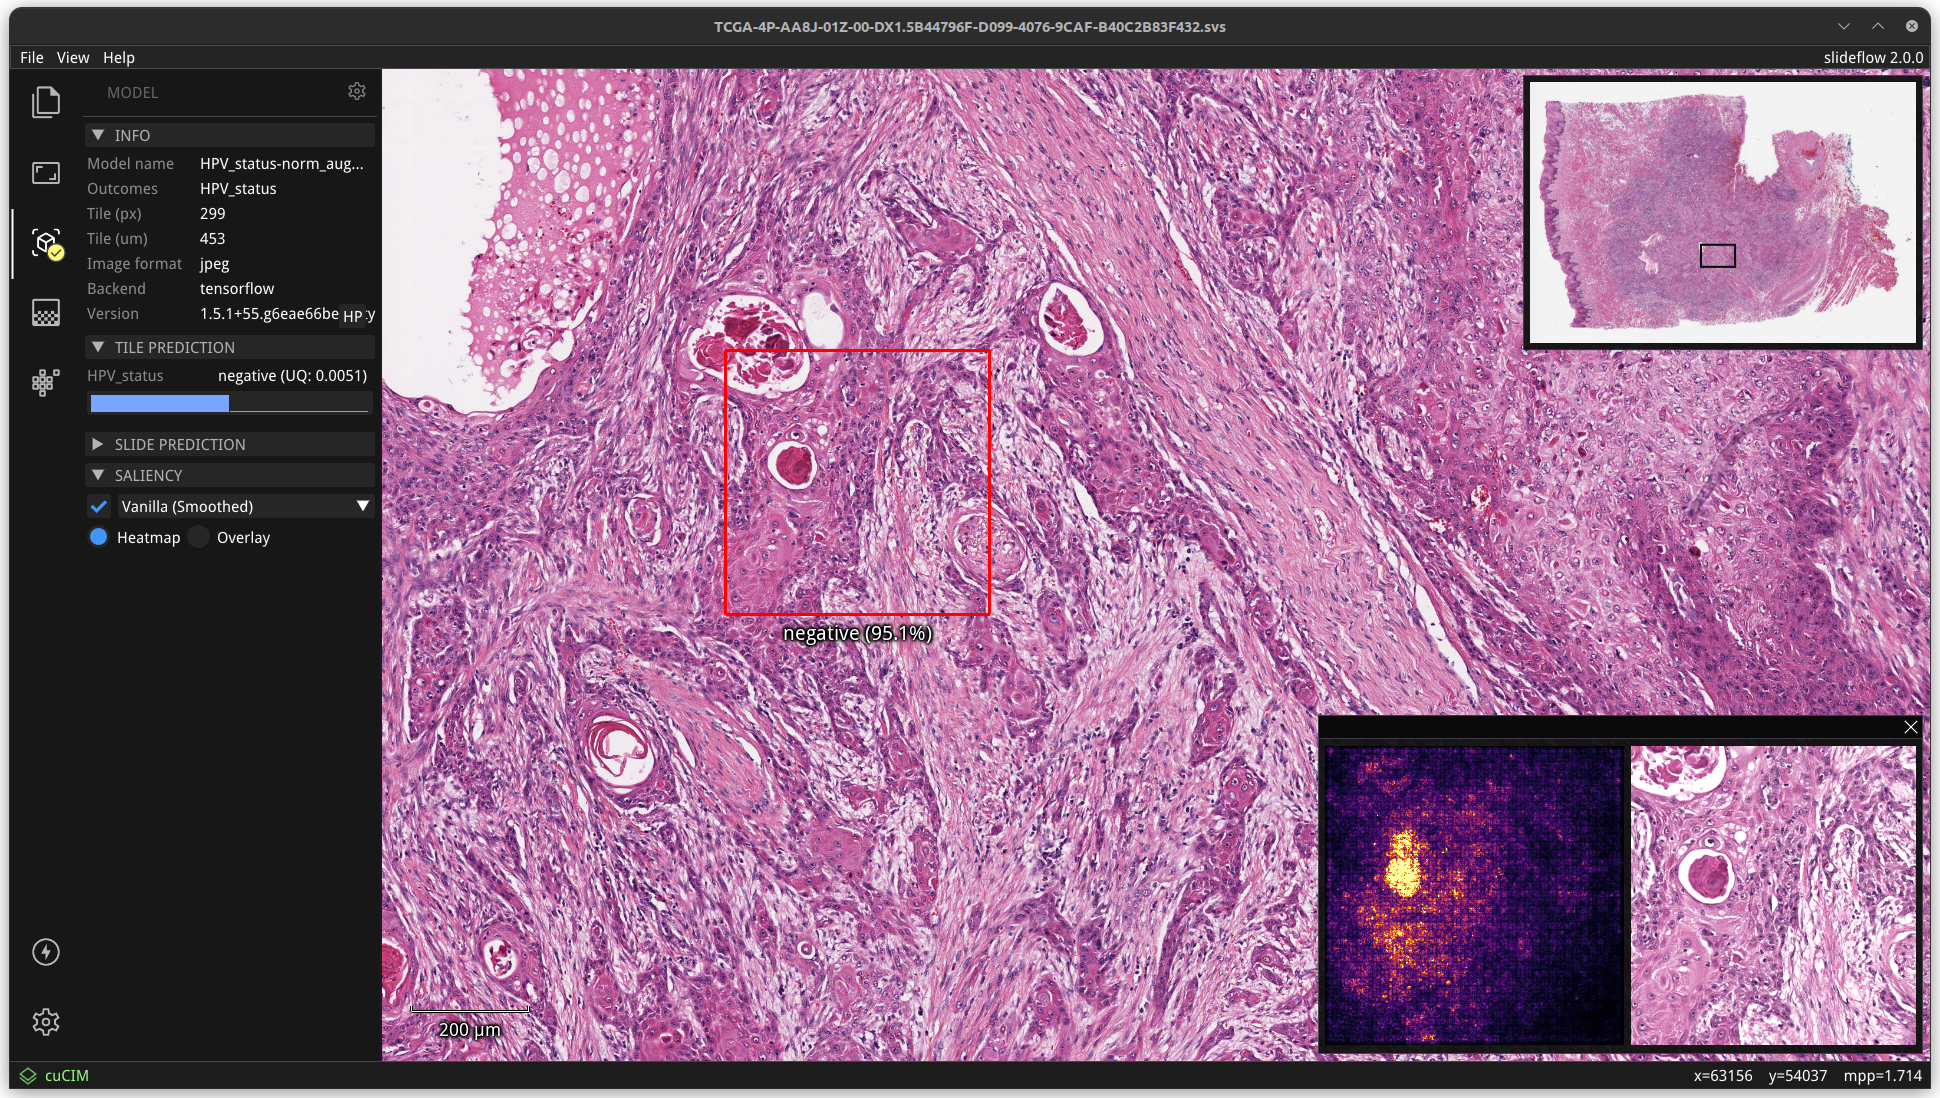
Step 6: Live visualization
Deploy the model: Finally, use a trained model to visualize predictions for whole-slide images with the interactive tool Slideflow Studio. This whole-slide image viewer includes deep learning tools enabling you to visualize model predictions on whole-slide images, standard JPG/PNG files, real-time camera feeds, and even Generative Adversarial Network (GAN)-generated images.