Tutorial 4: Model evaluation & heatmaps
In this tutorial, we will evaluate a trained model on a separate, held-out evaluation dataset.
Locate a saved model
First, locate a saved model to evaluate, which will be a *.zip file for PyTorch models and a directory for Tensorflow models. The directory structure for saved models trained with Tensorflow will look like:
models/
├── 00001-er_status_by_ihc-HP0 /
│   ├── er_status_by_ihc-HP0-epoch1/
         ...
...
And for PyTorch:
models/
├── 00001-er_status_by_ihc-HP0 /
│   ├── er_status_by_ihc-HP0-epoch1.zip
         ...
...
For this tutorial, we will assume that the final trained model is stored at /home/er_project/models/00003-er_status_by_ihc/er_status_by_ihc_epoch3.
The results we report are a continuation of the project described in Tutorial 1: Model training (simple).
Evaluation
To evaluate a saved model, use the slideflow.Project.evaluate() function:
model = '/home/er_project/models/00003-er_status_by_ihc/er_status_by_ihc_epoch3'

def main(P):
    P.evaluate(
        model,
        'er_status_by_ihc',
        filters={'dataset': ['eval'],
                 'er_status_by_ihc': ['Positive', 'Negative']}
    )
This function should yield the following final results:
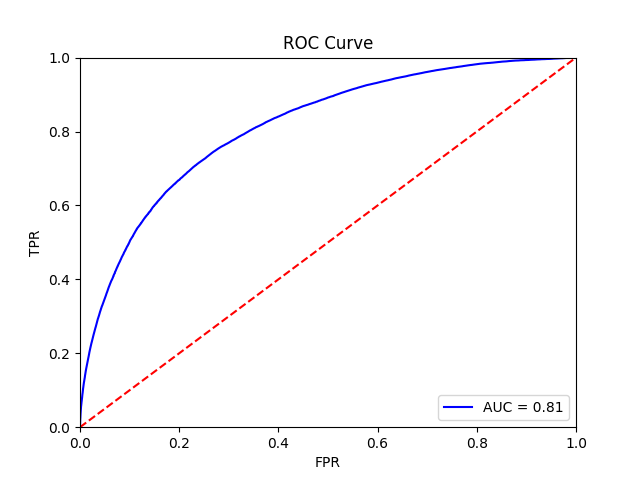
Tile-level receiver operator curve |
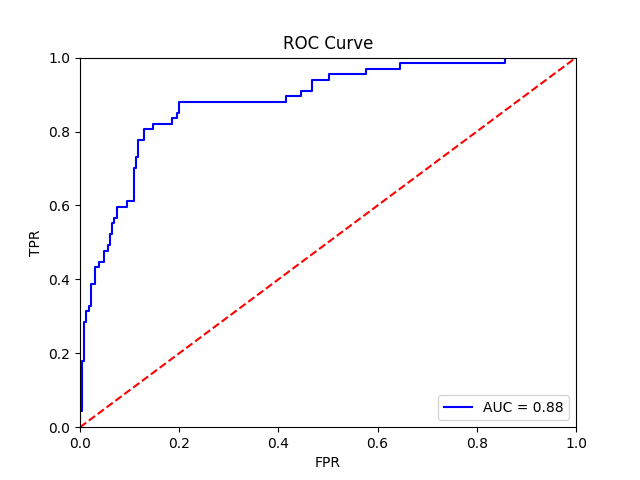
Patient-level receiver operator curve |
Heatmaps
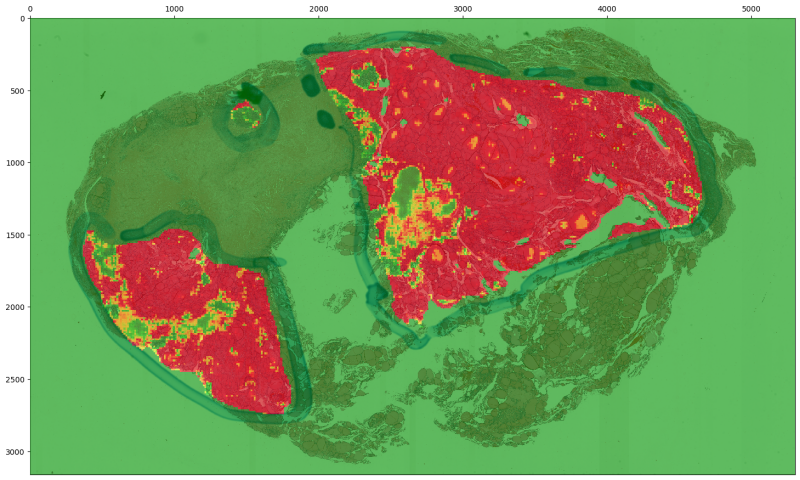
Predictive heatmaps can be generated for either individuals slides or for all slides in a dataset. We will give examples for both, starting with automatic heatmap generation for all slides in the evaluation dataset.
From a dataset
The slideflow.Project.generate_heatmaps() can be used to easily and quickly create predictive heatmaps for a dataset. The filters argument is used to specify which slides should be included.
model = '/home/er_project/models/00003-er_status_by_ihc/er_status_by_ihc_epoch3'

def main(P):
    P.generate_heatmaps(
        model,
        filters={'dataset': ['eval']},
        resolution='high' # options include "low", "medium" and "high"
    )
If the referenced model was trained with digital stain normalization, this will be automaticaly detected and used at the time of heatmap calculation. The heatmap thumbnail image will be displayed without normalization, however.
The resolution parameter indicates the stride at which tiles should be extracted from slides to generate predictions. "low" resolution yields predictions on non-overlapping slides (stride_div=1). "medium" resolutions uses tiles with 50% overlap (stide_div=2), and "high" resolution uses tiles with 75% overlap (stride_div=4).
Heatmaps are colored and scaled in a manner optimized for categorical outcomes, with the colorscale 0 (blue) -> 0.5 (white) -> 1.0 (red). To change this colorscaling (particularly important for regression outcomes), set vmin, vcenter, and vmax accordingly.
Heatmaps are displayed without any color interpolation by default. To generate a smoothed heatmap, interpolate colors with any strategy supported by matplotlib (including, for example, “bicubic”, “nearest”, “bilnear”, and many more) with the argument interpolation.
Heatmaps are saved by default in the project_folder/heatmaps folder. A separate image is saved for each outcome category, as well as a base non-annotated slide thumbnail and a thumbnail with an ROI overlay (if ROIs are available). If the model had three outcomes, the heatmaps folder would contain:
heatmaps/
├── er_status_by_ihc-HP0-epoch1 /
│   ├── slide_name-raw.png
│   ├── slide_name-raw+roi.png
│   ├── slide_name-0.png
│   ├── slide_name-1.png
│   ├── slide_name-2.png
         ...
...
From a single slide
Heatmaps can also be manually created with the slideflow.Heatmap class. To create a heatmap from a slide located at ‘/home/user/example.svs’, use the following syntax:
>>> import slideflow as sf
>>> heatmap = sf.Heatmap(
...     '/home/user/example.svs',
...     model='/path/to/model',
...     stride_div=4,           # optional, defaults to 1
...     num_threads=32,         # optional, defaults to 8
...     buffer='/mnt/ramdisk',  # optional
... )
To calculate heatmaps only within areas of an annotated ROI, you can pass the directory in which ROIs are contained to roi_dir, or pass the path (or list of ROI paths) to rois. The easiest way to do this is to let the slideflow.Dataset object handle this for you:
>>> import slideflow as sf
>>> P = sf.Project('/project/path')
>>> dataset = P.dataset(299, 302)
>>> heatmap = sf.Heatmap(
...     '/home/user/example.svs',
...     model='/path/to/model',
...     rois=dataset.rois(),
...     ...
... )
The heatmap can then be saved with slideflow.Heatmap.save(), which accepts a directory location as its first positional argument:
>>> heatmap.save('/save_dir')
Heatmap interpolation and colorscale settings are passed as additional arguments to the slideflow.Heatmap.save() function, and show_roi can be used to indicate whether ROIs should be shown on the thumbnail images:
>>> heatmap.save(
...     '/save_dir',
...     interpolation='bicubic',
...     vmin=5,
...     vcenter=15,
...     vmax=30,
...     show_roi=False
... )